Skip to content

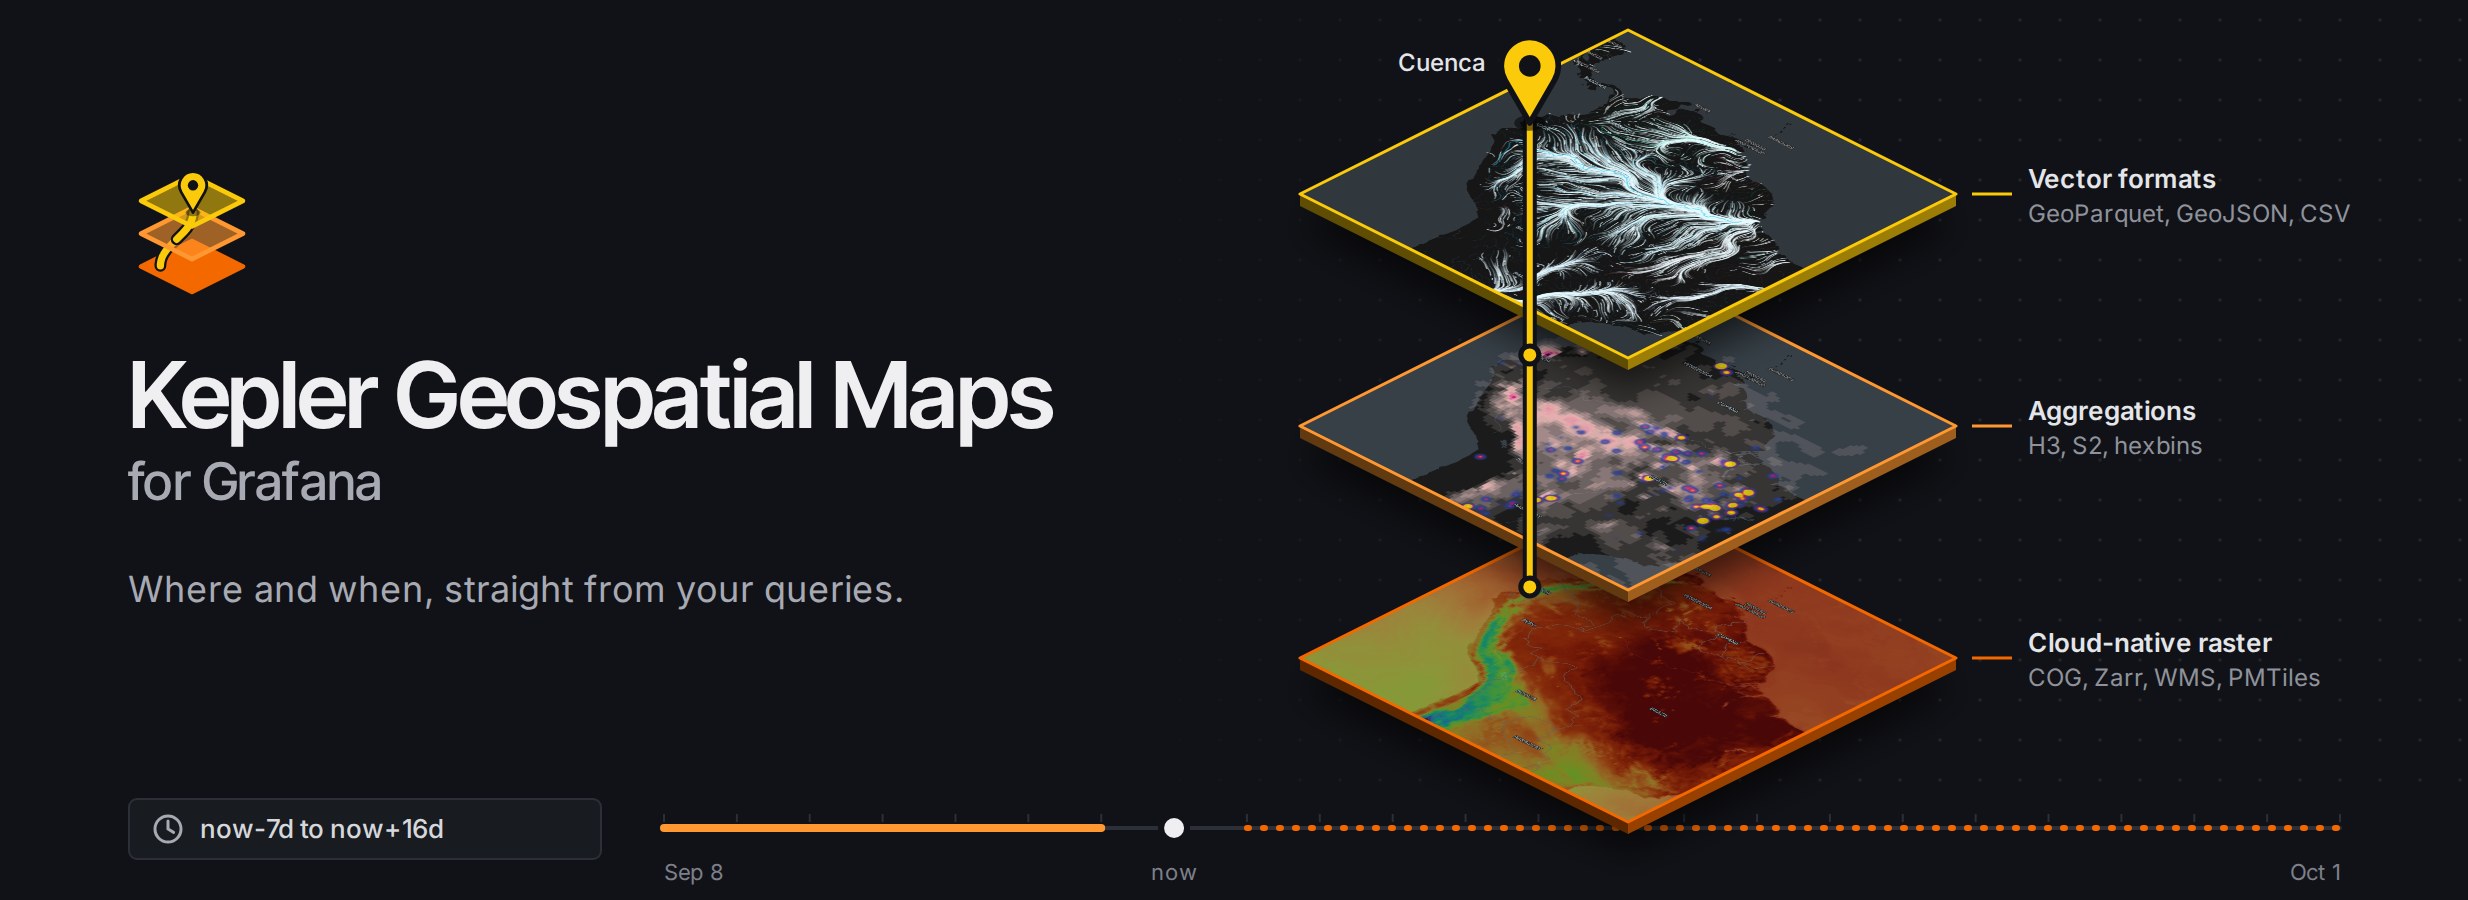
Kepler Geospatial MapsInteractive maps inside Grafana

kepler.gl running in the panel. Spatio-temporal data from any Grafana data source.

Kepler Geospatial Maps

Dashboards built with it

Six of them, each one a Grafana dashboard and nothing else — no account, no Mapbox token, no hosted service rendering the map. Every picture here is the panel drawing rows a query returned.

All six are running live at grafana.ubica.ec, along with a dozen more, on a public Grafana that lets anyone in as a read-only viewer. Nothing to install and nothing to sign up for: open one, drag its timeline, draw on the map. Several are labelled in Spanish; the maps are the point.

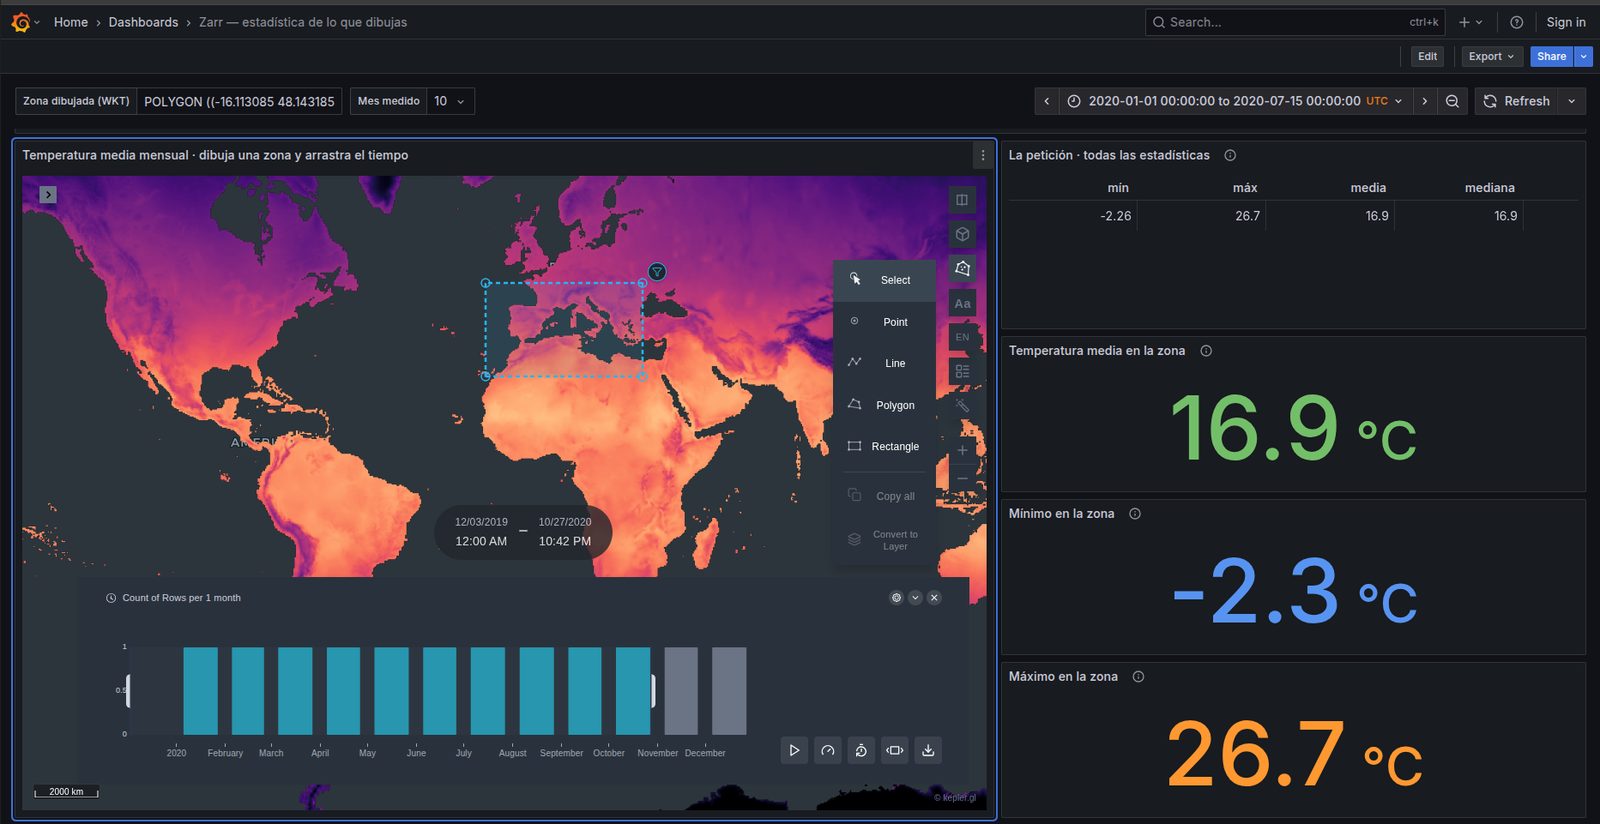
Global monthly temperature from a Zarr store, with a rectangle drawn over the Mediterranean and the mean, minimum and maximum beside it

Zarr, drawn and measured

A Zarr store rendered live, and the rectangle drawn on the map measured in the same month the layer is showing — mean, minimum and maximum, from one request.

Apache-2.0. Bundles kepler.gl (MIT) and flowmap.gl (Apache-2.0).