
Appearance
Layer gallery
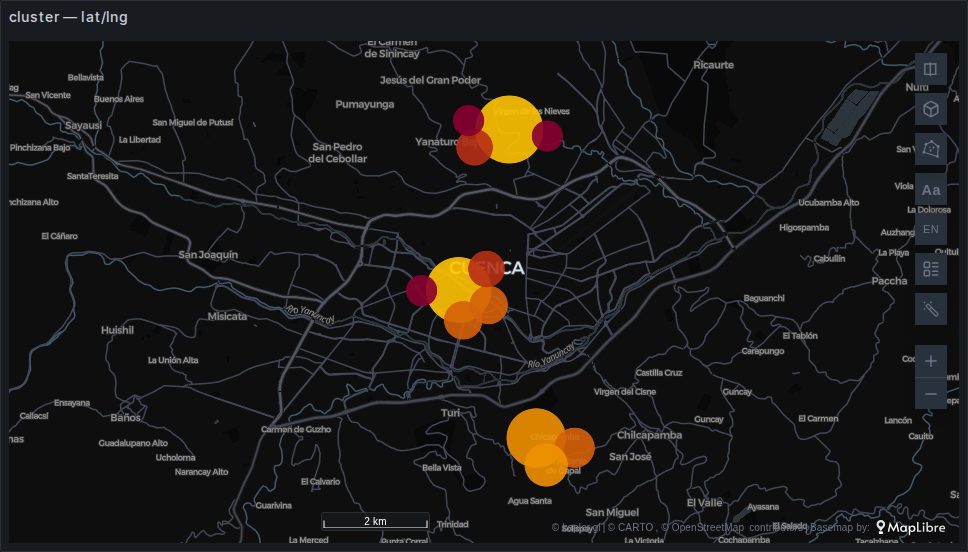
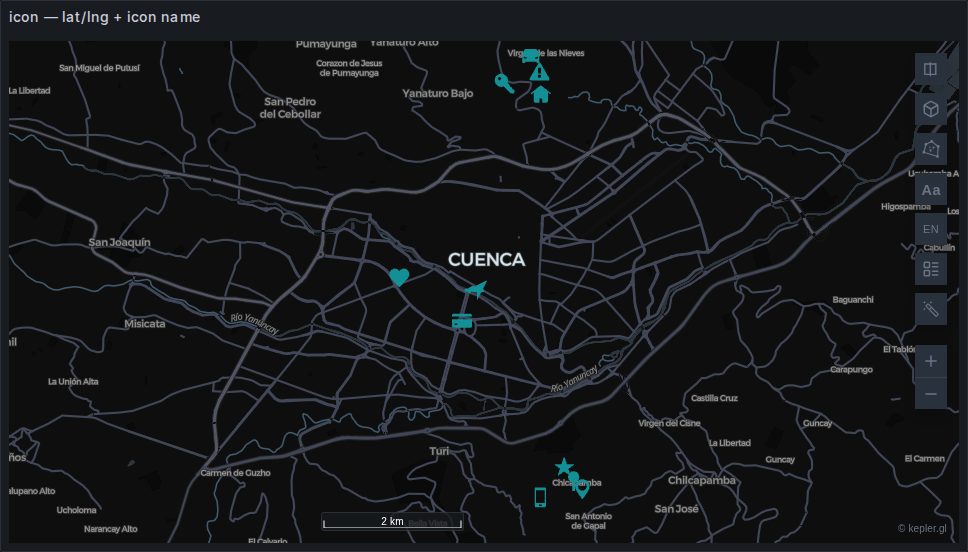
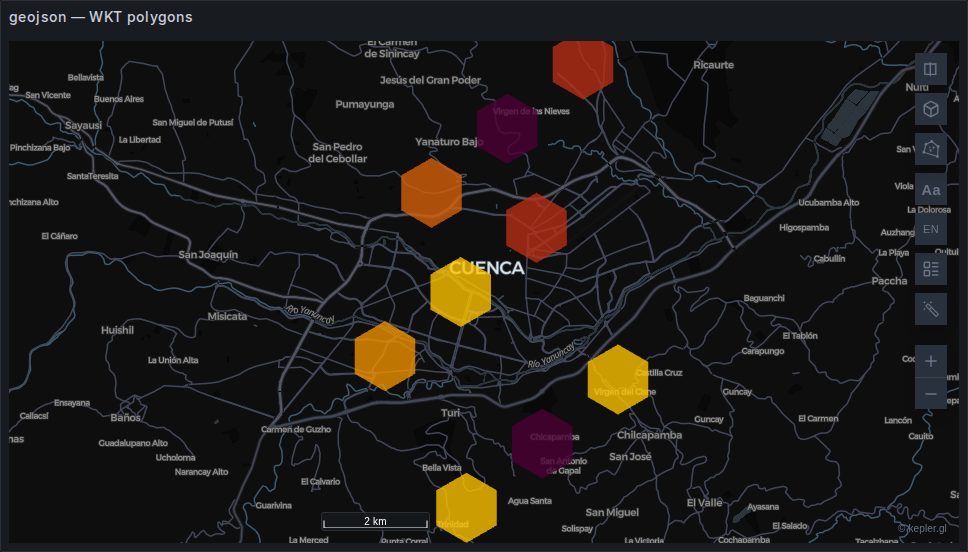
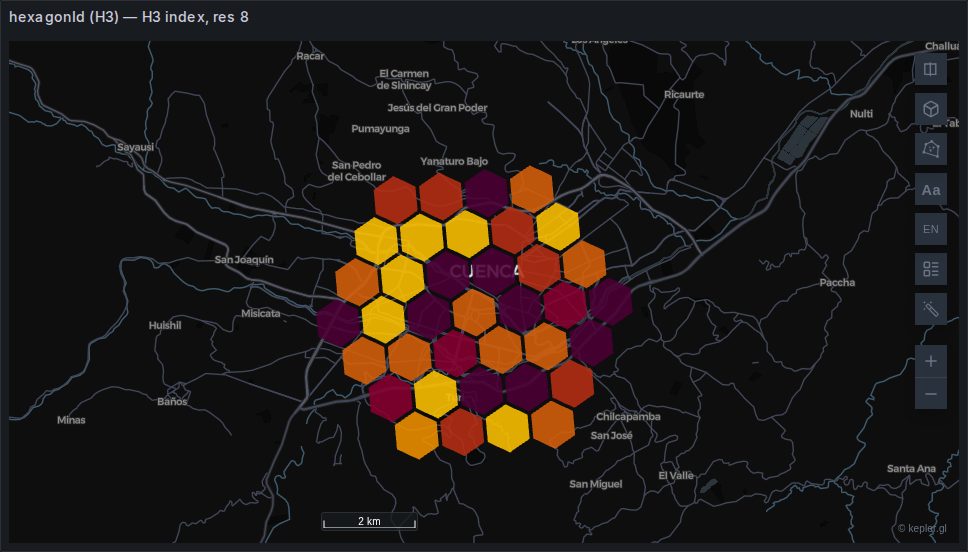
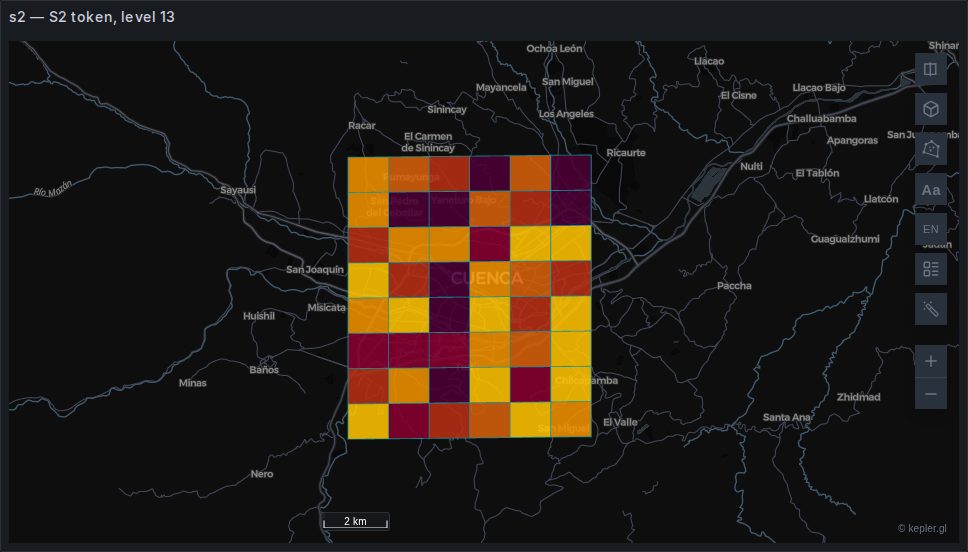
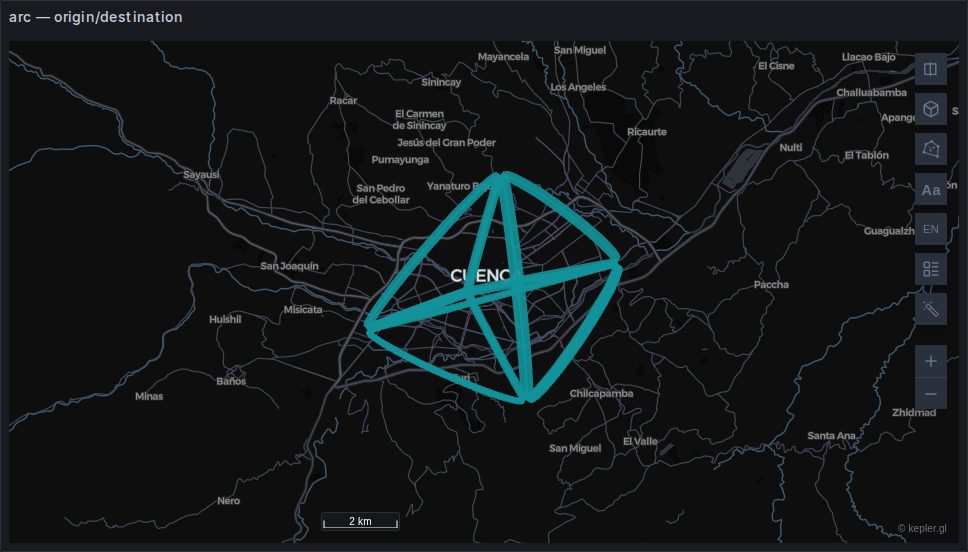
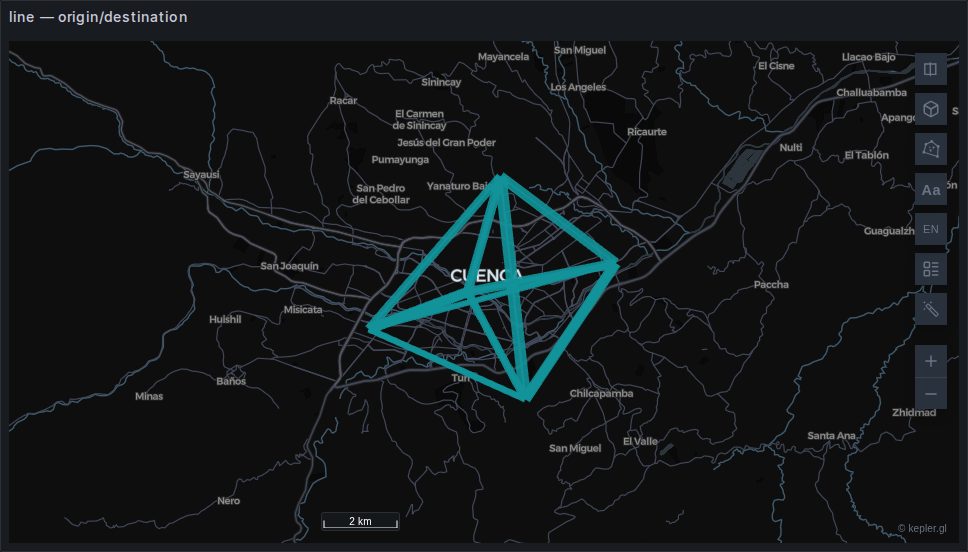
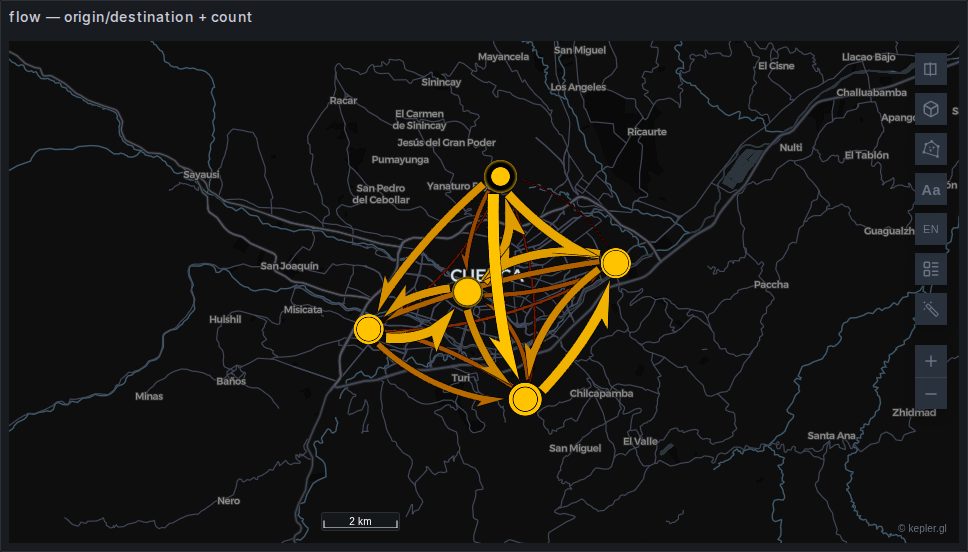
Every layer type the panel can build from query rows, with the query that produces it. Thirteen of kepler's twenty-one registered layer types can be driven by data — and the panel registers two more that kepler does not have: a flow field for a grid of velocities, and a Zarr tileset for a store of arrays.
Two of kepler's own, a5 and geohash, are grid-index layers like H3 and S2 but are not detected from a column; they can still be added by hand. See Layers configured with a URL.
Many of these are easier to judge moving than in a still: they are drawing right now on the live demo dashboards, which anyone can open as a read-only viewer.
Of the six that take a URL instead, two can now be driven by one as well — a query that returns a link to imagery draws a rasterTile layer, and one that names a service draws a wms layer. See Rasters and WMS services. The remaining four, and adding any of them by hand, are on Layers configured with a URL.
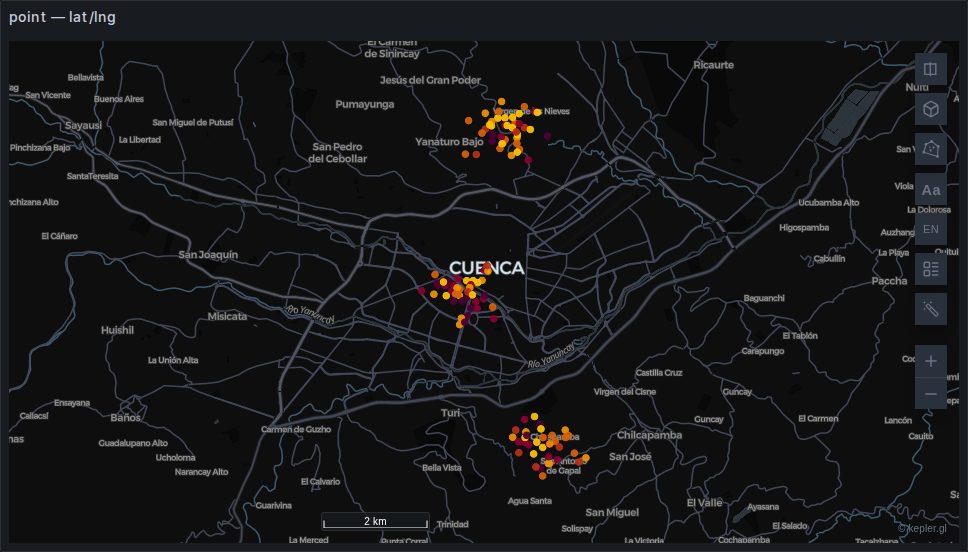
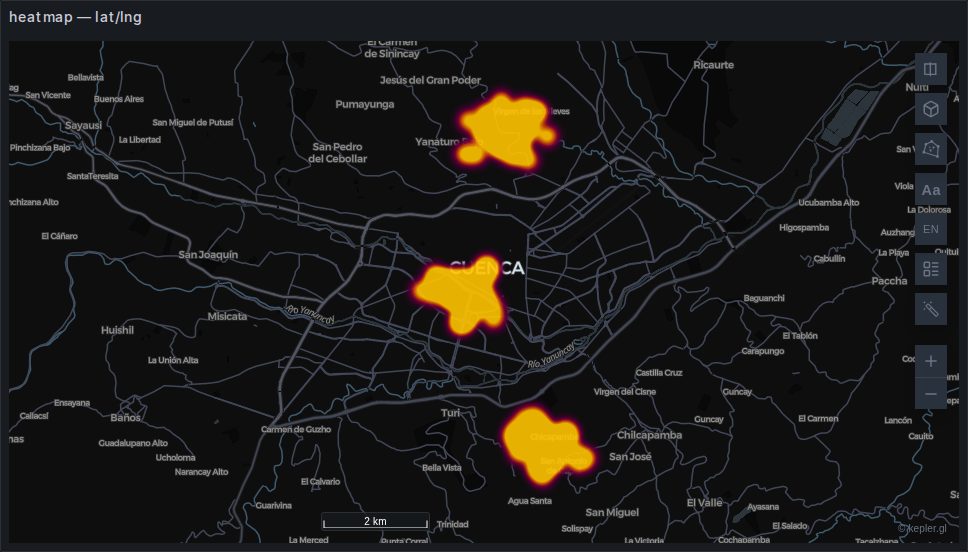
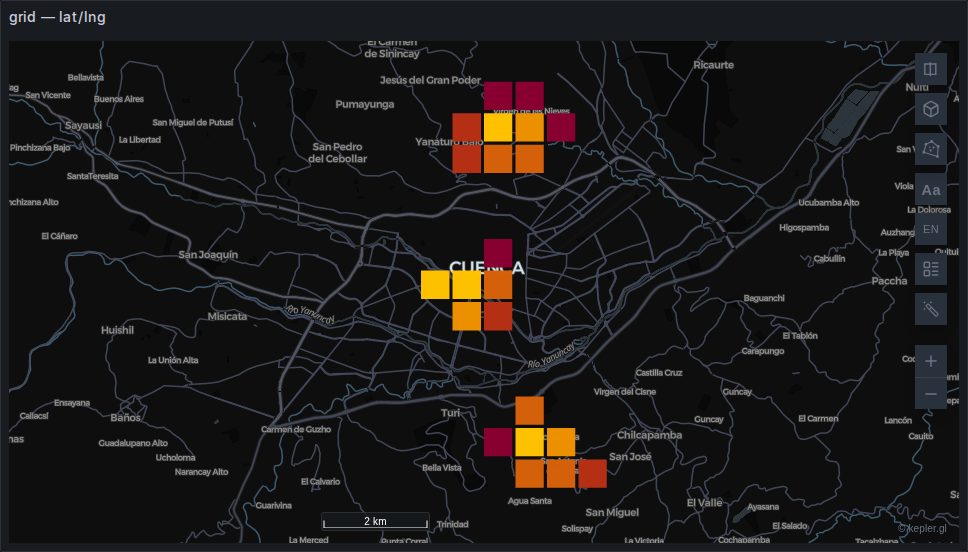
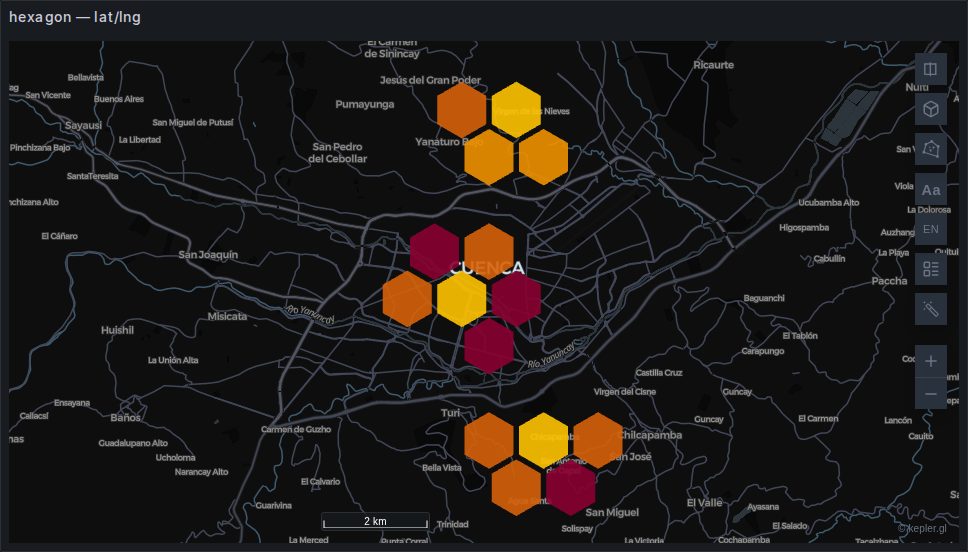
Which ones you get without asking
Some are built for you when the columns are right. The rest you add by hand in kepler's layer panel, choosing the dataset and pointing the layer's columns at it.
| Built automatically | Trigger |
|---|---|
| point | a latitude/longitude pair |
| geojson | a geometry column |
| hexagonId (H3) | a column whose values are valid H3 indices |
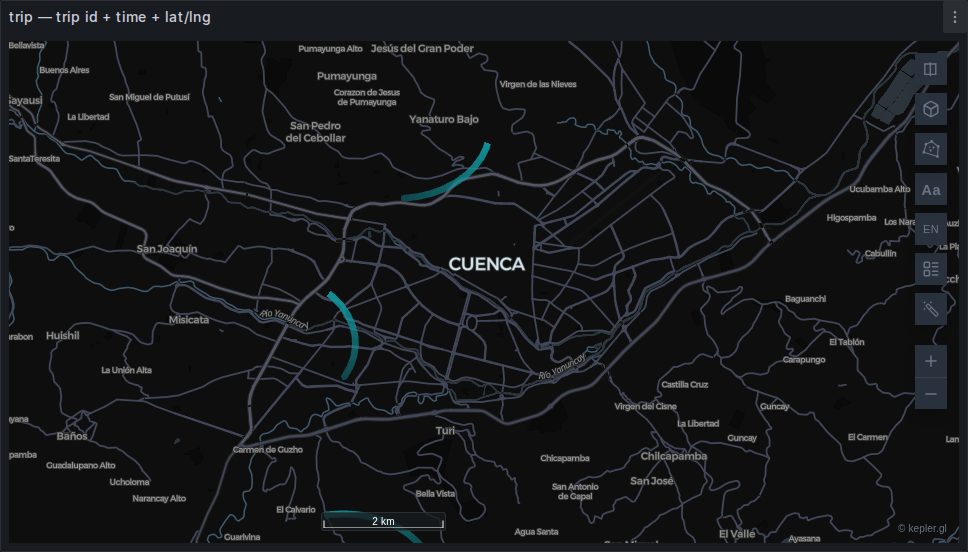
| trip | a trip id and a time and a position |
| flow | origin and destination columns |
| flowfield | a position and a velocity, and no trip id — a layer type this plugin adds, which kepler does not have. See Velocity fields. |
| vectorfield | never guessed — switch a flow field's type, or add it from Add Layer. Arrows and wind barbs over the same grid. See Velocity fields. |
See How a query becomes a map.
About these images
They come from the plugin's own layer gallery dashboard, provisioning/dashboards/layers.json, which is provisioned into the dev Grafana and shows all thirteen on synthetic data around Cuenca, Ecuador. Bring it up with npm run server and open Kepler.gl layer gallery.
They are captured by npm run docs:shots, one panel at a time through Grafana's single-panel view — thirteen maps on one page would exceed the browser's WebGL context budget and black out the oldest. kepler's side panel and playback widget are hidden for the shot; they overlay the map rather than sitting beside it, so hiding them reveals the map underneath.
The gallery is a regression test
A layer type that stops rendering after a kepler.gl version bump is visible immediately as a blank map in a page you scroll. That is the reason it exists, and the reason it is worth keeping current.