
Appearance
Tutorial 2 — Animate trajectories
Three vehicles crossing Cuenca, as animated paths with a playback timeline. About ten minutes.
You need: nothing but the panel. This one uses Grafana's built-in TestData DB, which is present in every install — so it works even where you cannot add a plugin.
1. Create the panel
New dashboard → Add visualisation → TestData DB → visualisation Kepler Geospatial Maps.
2. Paste the data
In the query editor set Scenario to CSV Content, and paste:
csv
trip_id,time,latitude,longitude,speed_kmh
bus-101,2026-08-19T08:00:00Z,-2.93500,-79.04500,26
bus-101,2026-08-19T08:02:00Z,-2.92684,-79.03604,30
bus-101,2026-08-19T08:04:00Z,-2.91902,-79.02688,32
bus-101,2026-08-19T08:06:00Z,-2.91181,-79.01734,31
bus-101,2026-08-19T08:08:00Z,-2.90539,-79.00734,28
bus-101,2026-08-19T08:10:00Z,-2.89973,-78.99688,22
bus-101,2026-08-19T08:12:00Z,-2.89469,-78.98604,16
bus-101,2026-08-19T08:14:00Z,-2.89000,-78.97500,10
bus-204,2026-08-19T08:00:00Z,-2.87500,-79.03000,26
bus-204,2026-08-19T08:02:00Z,-2.87969,-79.02104,30
bus-204,2026-08-19T08:04:00Z,-2.88473,-79.01188,32
bus-204,2026-08-19T08:06:00Z,-2.89039,-79.00234,31
bus-204,2026-08-19T08:08:00Z,-2.89681,-78.99234,28
bus-204,2026-08-19T08:10:00Z,-2.90402,-78.98188,22
bus-204,2026-08-19T08:12:00Z,-2.91184,-78.97104,16
bus-204,2026-08-19T08:14:00Z,-2.92000,-78.96000,10
taxi-77,2026-08-19T08:00:00Z,-2.90500,-79.01000,26
taxi-77,2026-08-19T08:02:00Z,-2.90041,-79.00961,30
taxi-77,2026-08-19T08:04:00Z,-2.89616,-79.00902,32
taxi-77,2026-08-19T08:06:00Z,-2.89253,-79.00805,31
taxi-77,2026-08-19T08:08:00Z,-2.88967,-79.00663,28
taxi-77,2026-08-19T08:10:00Z,-2.88759,-79.00473,22
taxi-77,2026-08-19T08:12:00Z,-2.88612,-79.00247,16
taxi-77,2026-08-19T08:14:00Z,-2.88500,-79.00000,10
TestData parses the ISO timestamps into a real time column and the coordinates into numbers, so nothing needs typing by hand.
Set the dashboard time range to cover it — an absolute range of 2026-08-19 07:00 to 2026-08-19 09:00 works. If the map is empty, this is why.
3. What happened
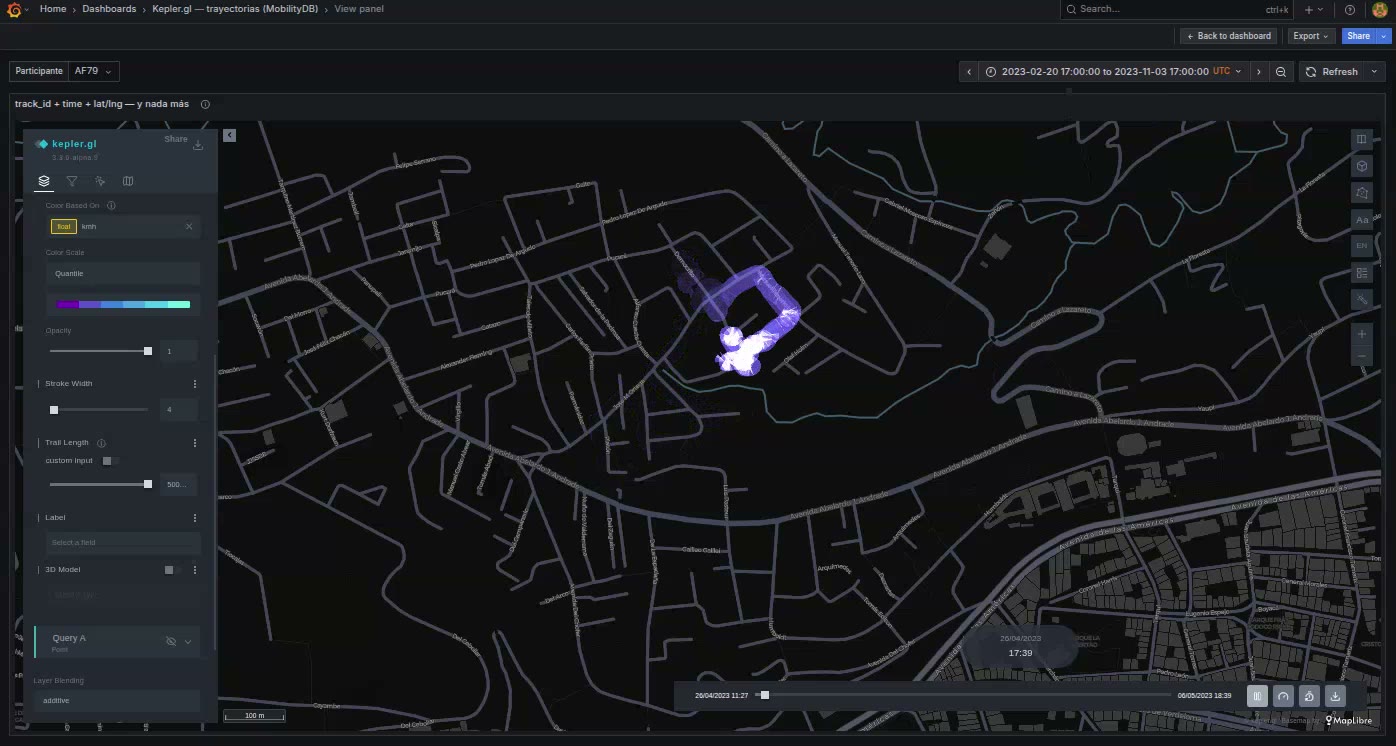
You did not create a layer, and yet there is a Trip layer and a playback bar at the bottom.
Three columns did that: a trip id to group by, a time to order by, and a position. Miss any one and you get loose points instead — which is a useful diagnostic when you expected animation.
kepler will not build this layer itself; its own heuristic insists on a column literally named id, and real tables call it vehicle_id or trip_id. So the panel emits it. See Trajectories.
4. Press play
The paths draw themselves as the playhead moves.
It looks empty when paused at the start
At the beginning of the window every trail has zero length. That is not a fault — it is what an animation looks like before it starts. Press play, or drag the playhead into the middle.
5. Trail length
In the layer settings, find Trail Length. It is the control that changes the character of the map most:
- Short — three comets moving along their routes.
- Long — the routes drawing themselves and staying drawn.
Try both. There is no correct answer; it depends on whether you are showing movement or coverage.
6. Colour by speed
Color Based On → speed_kmh.
This is why the default Trip layer mode is Table columns: it keeps one row per GPS ping, so every column your query returned stays available for colour, filters and tooltips. The alternative mode folds each trip into a single row carrying only the path — far less data, and speed_kmh disappears with everything else.
Switch Panel options → Trip layer to GeoJSON and watch speed_kmh vanish from the colour options. Switch it back.
7. Draw it as points instead
Sometimes you want the pings, not the paths.
Panel options → Field mapping → Trip ID → None. The trips become loose points.
Note that the dropdown has an explicit None, rather than you clearing the field. Clearing hands the role back to autodetection, which would find trip_id again immediately — None switches the role off.
Set it back to autodetected to restore the trips.
8. Save
Map configuration → Save current map, then save the dashboard.
What you learned
- A trip id, a time and a position are all that a trajectory needs.
- A Trip layer draws nothing until its clock runs.
- Trail length is a storytelling decision, not a setting to get right.
- Table columns mode is what keeps the rest of your data usable.
- None in field mapping is a real answer, distinct from an empty field.
With your own data
The shape is the same whatever the source:
sql
SELECT vehicle_id AS trip_id,
       ST_Y(geom) AS latitude,
       ST_X(geom) AS longitude,
       ts         AS time,
       speed_kmh
FROM vehicle_positions
WHERE $__timeFilter(ts)
ORDER BY vehicle_id, ts;
Next
Tutorial 3 — An origin–destination flow map, which also needs no data source.